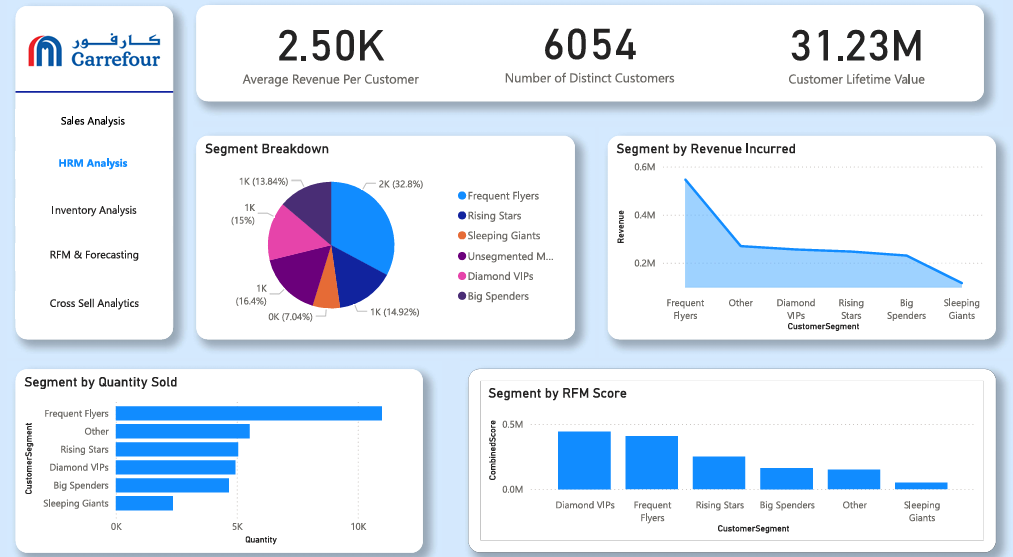
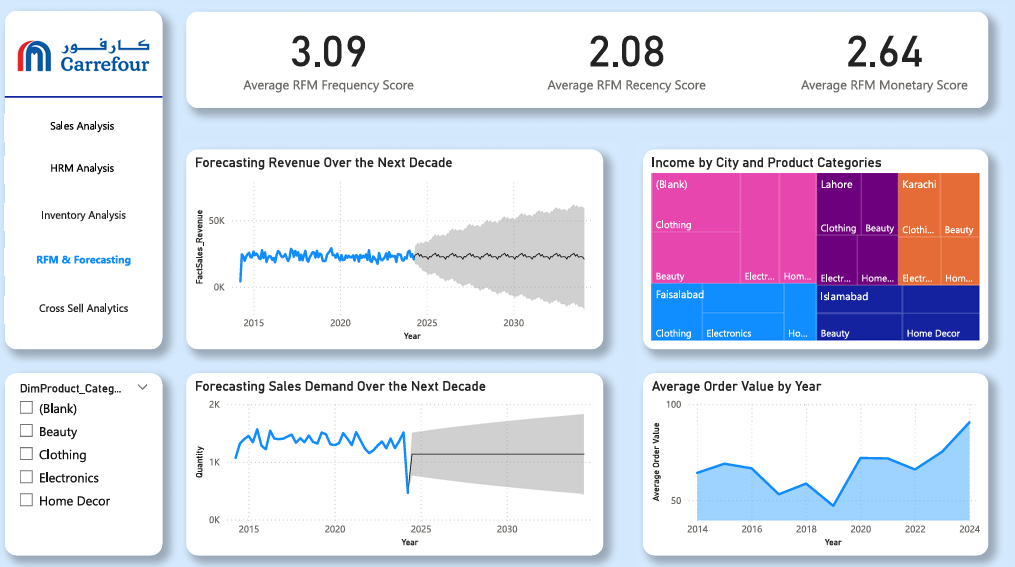
One of our standout client projects involved designing a comprehensive Power BI Dashboard for a Management Information Systems (MIS) course project. The client needed a visually engaging and highly functional dashboard that could turn raw business data into clear, actionable insights. Guided by Professor Owlbert’s philosophy of smart simplicity, we developed an interactive dashboard showcasing key metrics like sales performance, customer segmentation, and operational efficiency.
The final product not only impressed the client’s instructors but also demonstrated the power of data-driven decision-making — a perfect example of how Assignment Maker Pro blends academic excellence with real-world skills!
The Power BI project was structured around a well-organized star schema, ensuring optimal data retrieval and analysis efficiency. Fact tables captured essential transactional data, while dimension tables provided detailed contextual information such as customer demographics, product categories, and regional sales performance. Relationships between tables were precisely defined to support accurate aggregations and drill-down capabilities. DAX (Data Analysis Expressions) functions were employed to create dynamic measures and KPIs, enhancing the dashboard’s interactivity. Additionally, slicers and filters were integrated to allow users to customize views effortlessly, making the overall design both powerful and user-friendly.
In this project, Assignment Maker Pro delivered a complete academic package that covered every major component required for a top-tier MIS submission. The final deliverables included a professionally designed slide presentation summarizing key findings, insights, and visual highlights from the data analysis. Alongside the slides, the client received fully functional Power BI reports, interactive dashboards, and supplementary Excel files that supported the project’s raw data and intermediate steps.
A major part of the project involved data cleaning and preparation. The raw datasets were carefully cleaned to remove inconsistencies, duplicates, and missing values, ensuring the accuracy and reliability of the final analysis. Advanced Excel techniques like pivot tables, conditional formatting, and lookup functions were used before importing the data into Power BI. This preprocessing ensured seamless schema integration and laid the foundation for building efficient relationships between different data tables.
For the Power BI setup, a star schema model was implemented to maximize query performance and make the reports highly interactive. Relationships were mapped clearly between fact and dimension tables, using primary keys and foreign keys. Custom DAX measures were developed to calculate dynamic KPIs such as sales growth, customer retention, and revenue by region. The result was a sleek, easy-to-navigate Power BI dashboard that allowed users to drill down into data, filter by multiple variables, and extract actionable insights effortlessly.